Porsche Holding Demand Prediction Dashboard
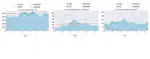
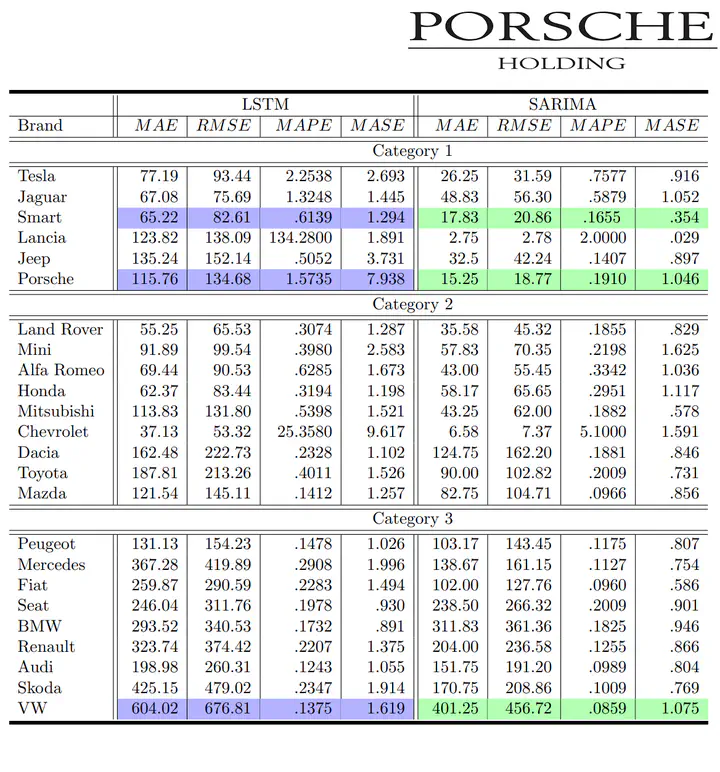 Results of LSTM and SARIMA models predicting monthly car orders.
Project Overview (July 2016 – July 2018)
At Know Center Research, we collaborated with Porsche Holding GmbH (Porsche Holding Salzburg), Europe’s largest automotive distributor, representing Volkswagen Group brands in wholesale, retail, and after-sales services. Porsche sought an accurate time-series prediction solution to optimize monthly car orders based on historical sales data.
Technical Challenges
Key challenges faced in this project included:
- Handling large and varied time-series datasets
- Performing thorough data cleaning and exploratory analysis
- Conducting comprehensive hyperparameter optimization
- Implementing accurate linear and non-linear predictive models
Technologies & Methods
The solution was built using advanced data analytics and visualization tools:
- Machine Learning & Analysis: Python, R, ARIMA, SARIMA, LSTM neural networks (Keras)
- Data Visualization & Dashboard: Interactive dashboards using Plotly
- Data Exploration & Cleaning: Extensive data preprocessing, feature engineering, and exploratory data analysis (EDA)
- Research & Publication: Scientific publication highlighting methodology and results
Results & Impact
- Delivered an end-to-end predictive analytics dashboard integrated into Porsche Holding’s operational processes
- Improved accuracy in predicting monthly car order requirements
- Recognized internally with the company’s Project Excellence Silver Award
- Successfully collaborated on a research publication titled “Gone in 30 days! Predictions for car import planning” in the journal Information Technology
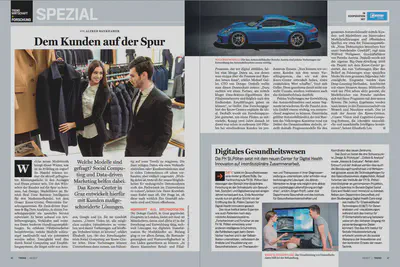
- Featured as a success story in Austria’s Trend magazine
Personal Contribution
As a Software Engineer, ML Engineer, and Data Scientist, my responsibilities included:
- Developing the complete data processing and cleaning pipeline
- Conducting extensive data exploration and feature engineering
- Researching and implementing linear and non-linear time-series predictive models (ARIMA, SARIMA, LSTM)
- Creating interactive visualizations and predictive analytics dashboards with Plotly
- Co-authoring the research publication and presenting
Tomislav Đuričić
Researcher / Machine Learning Engineer / Software Engineer
My research interests include social-based recommender systems, graph neural networks and user modeling.